Travel Time Reliability (TTR) measures along with average travel time are reported as measures of congestion. The main Travel Time Reliability Indices are Travel Time Index (TTI), Buffer Index (BI), and Planning Time Index (PTI). More information about these indices and how they are calculated can be found on “Travel Time Reliability: How to Measure and Why it is Important?“
Travel Time Reliability analysis calculates and compares TTI, BI, and PTI of your desired links and routes and displays the graphs in 24-hour format. Each set represents a link or route within the selected time range.
For adding a new set:
- Click on the Add button.
- Choose a proper name for the set.
- Select a desired link or route.
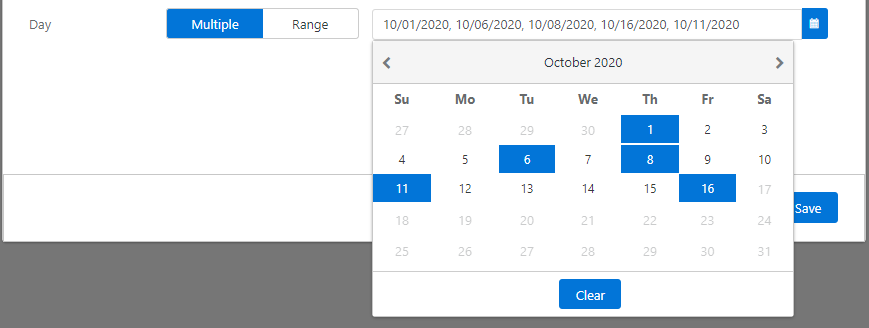
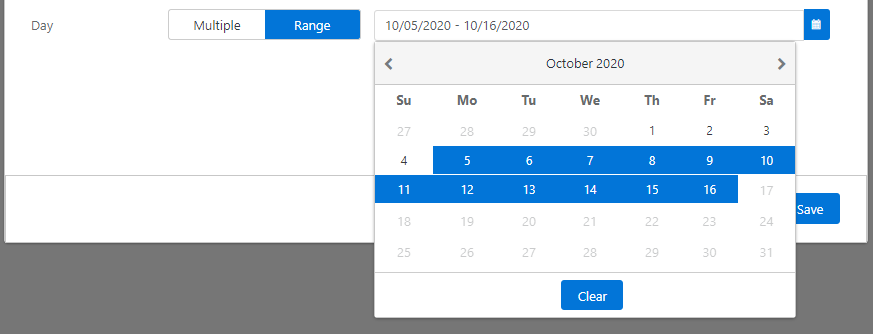
- Specify the time for data aggregation. There are two options:
- Multiple: Users can select multiple days one by one by clicking on the calendar.

- Range: For choosing a time range, first click on the start date and then the end date. All the days between the start and end dates will be selected automatically.

- Click on the “Save” button.
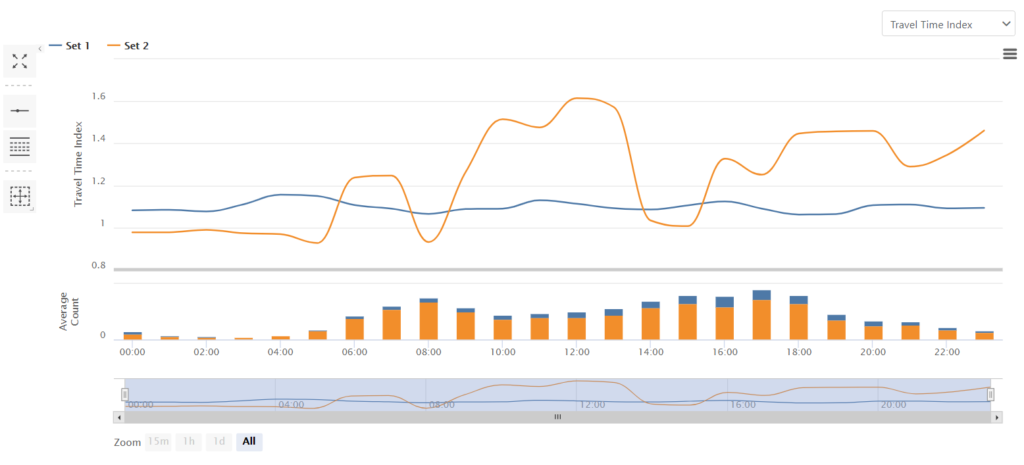
Figure 1 shows a sample Travel Time Index chart for two different routes. You can switch between TTI, BI, and PTI charts using the top right side drop-down menu.

Tip: For more information about the chart options, please see the Insight Charts Guide.
