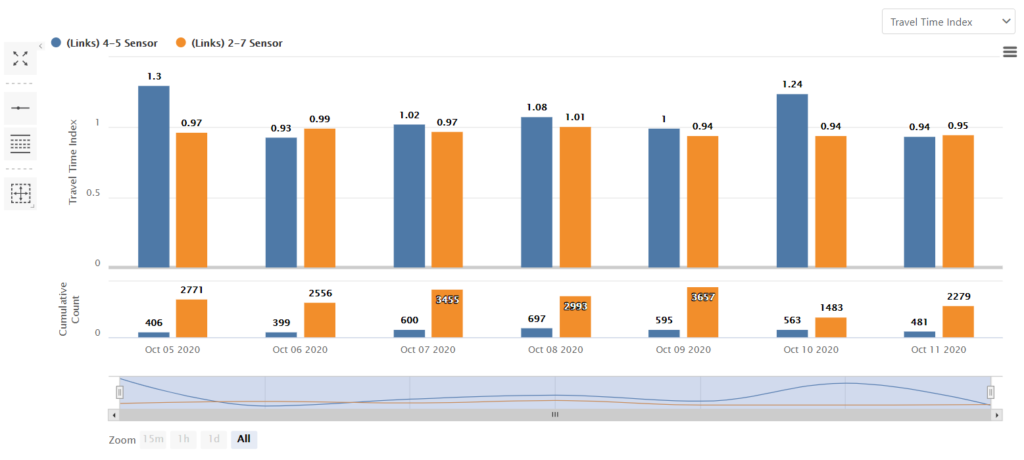
Travel Time Reliability Trends represent and compare the average Travel Time, Buffer, and Planning Time Indices of two or more links or routes for selected days or months. Cumulative vehicle counts are also calculated for each link or route in this analysis.
You can also exclude some days of a week or hours of a day data from the analysis based on your needs.
After choosing one or more routes or links, you should select the desired days or months for analysis. Figure 1 indicates a sample average travel time index chart of two links.

You can switch between different travel time reliability charts by using the top right side drop-down menu.
